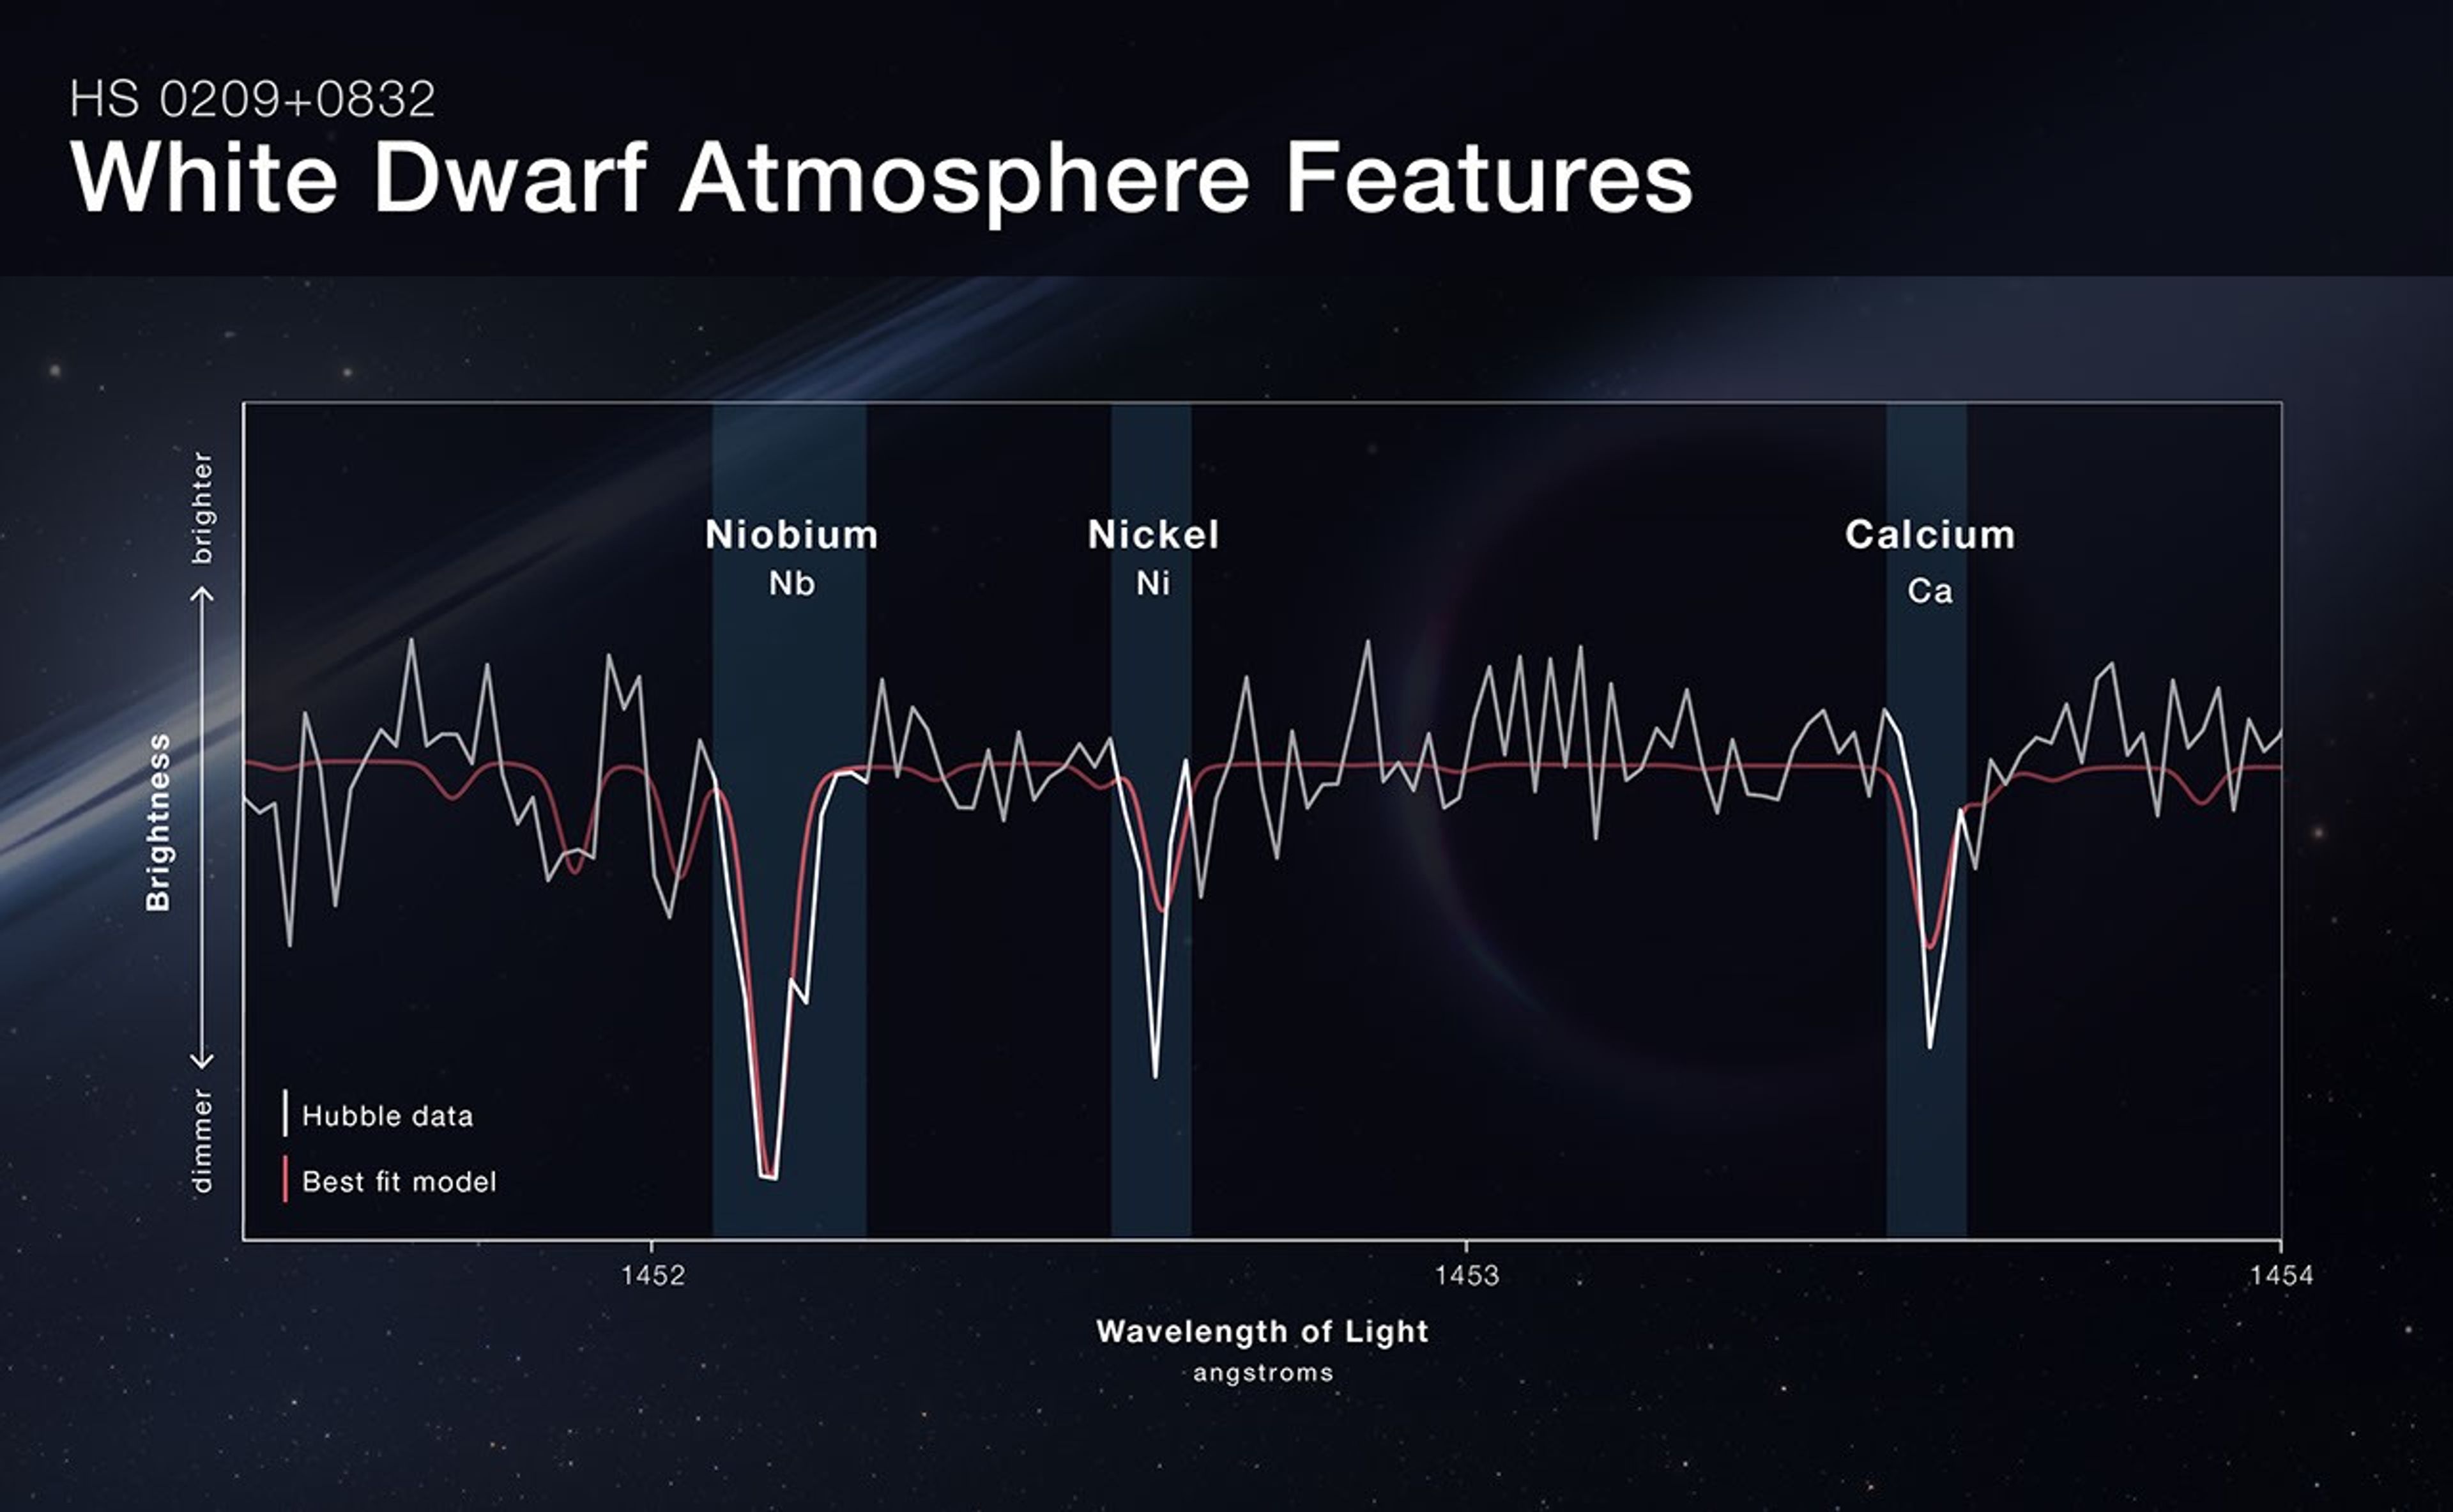
Line graph titled HS 0209+0832, White Dwarf Atmosphere Features. Hubble Space Telescope spectral data is shown in white, compared with a best fit model in red. The vertical y axis is labeled Brightness, with brighter at the top and dimmer at the bottom. The horizontal x axis is labeled Wavelength of light, angstroms. One-third of the way across the x axis is labeled 1452. To the right of the graph’s center is angstrom label 1453, and the right edge of the graph is labeled angstrom 1454.
Three dr
Line graph titled HS 0209+0832, White Dwarf Atmosphere Features. Hubble Space Telescope spectral data is shown in white, compared with a best fit model in red. The vertical y axis is labeled Brightness, with brighter at the top and dimmer at the bottom. The horizontal x axis is labeled Wavelength of light, angstroms. One-third of the way across the x axis is labeled 1452. To the right of the graph’s center is angstrom label 1453, and the right edge of the graph is labeled angstrom 1454.
Three dr图:NASA