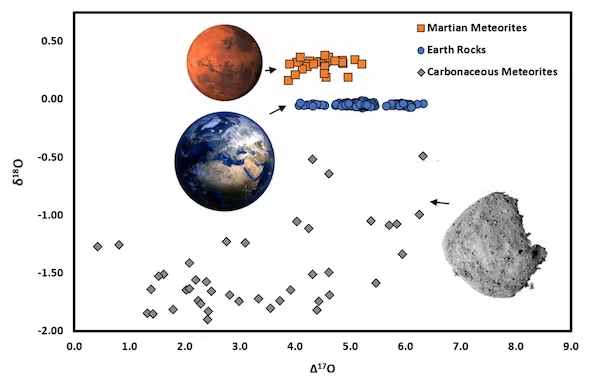
航天图片资料 · a plot graph shows grey dots along the bottom with a grey asteroid on the bottom right. earth hangs middle left, with mars above. both planets have many dots, blue and orange, respectively, a crowded near the top right area of each planet.
a plot graph shows grey dots along the bottom with a grey asteroid on the bottom right. earth hangs middle left, with mars above. both planets have many dots, blue and orange, respectively, a crowded near the top right area of each planet.
资料最后更新时间:
- 图像 SHA-256 校验编号
- d37a1b7ecfaf9c6c24e7503f7b28cb22fa1139602d9ddd5e0f7a44fe816c0af9
- 来源署名
- Space.com
- 图像宽度(像素)
- 600
- 图像高度(像素)
- 381
原始图注:
a plot graph shows grey dots along the bottom with a grey asteroid on the bottom right. earth hangs middle left, with mars above. both planets have many dots, blue and orange, respectively, a crowded near the top right area of each planet.

图像 SHA-256 校验编号:d37a1b7ecfaf9c6c24e7503f7b28cb22fa1139602d9ddd5e0f7a44fe816c0af9
来源署名:Space.com
图像宽度(像素):600
图像高度(像素):381