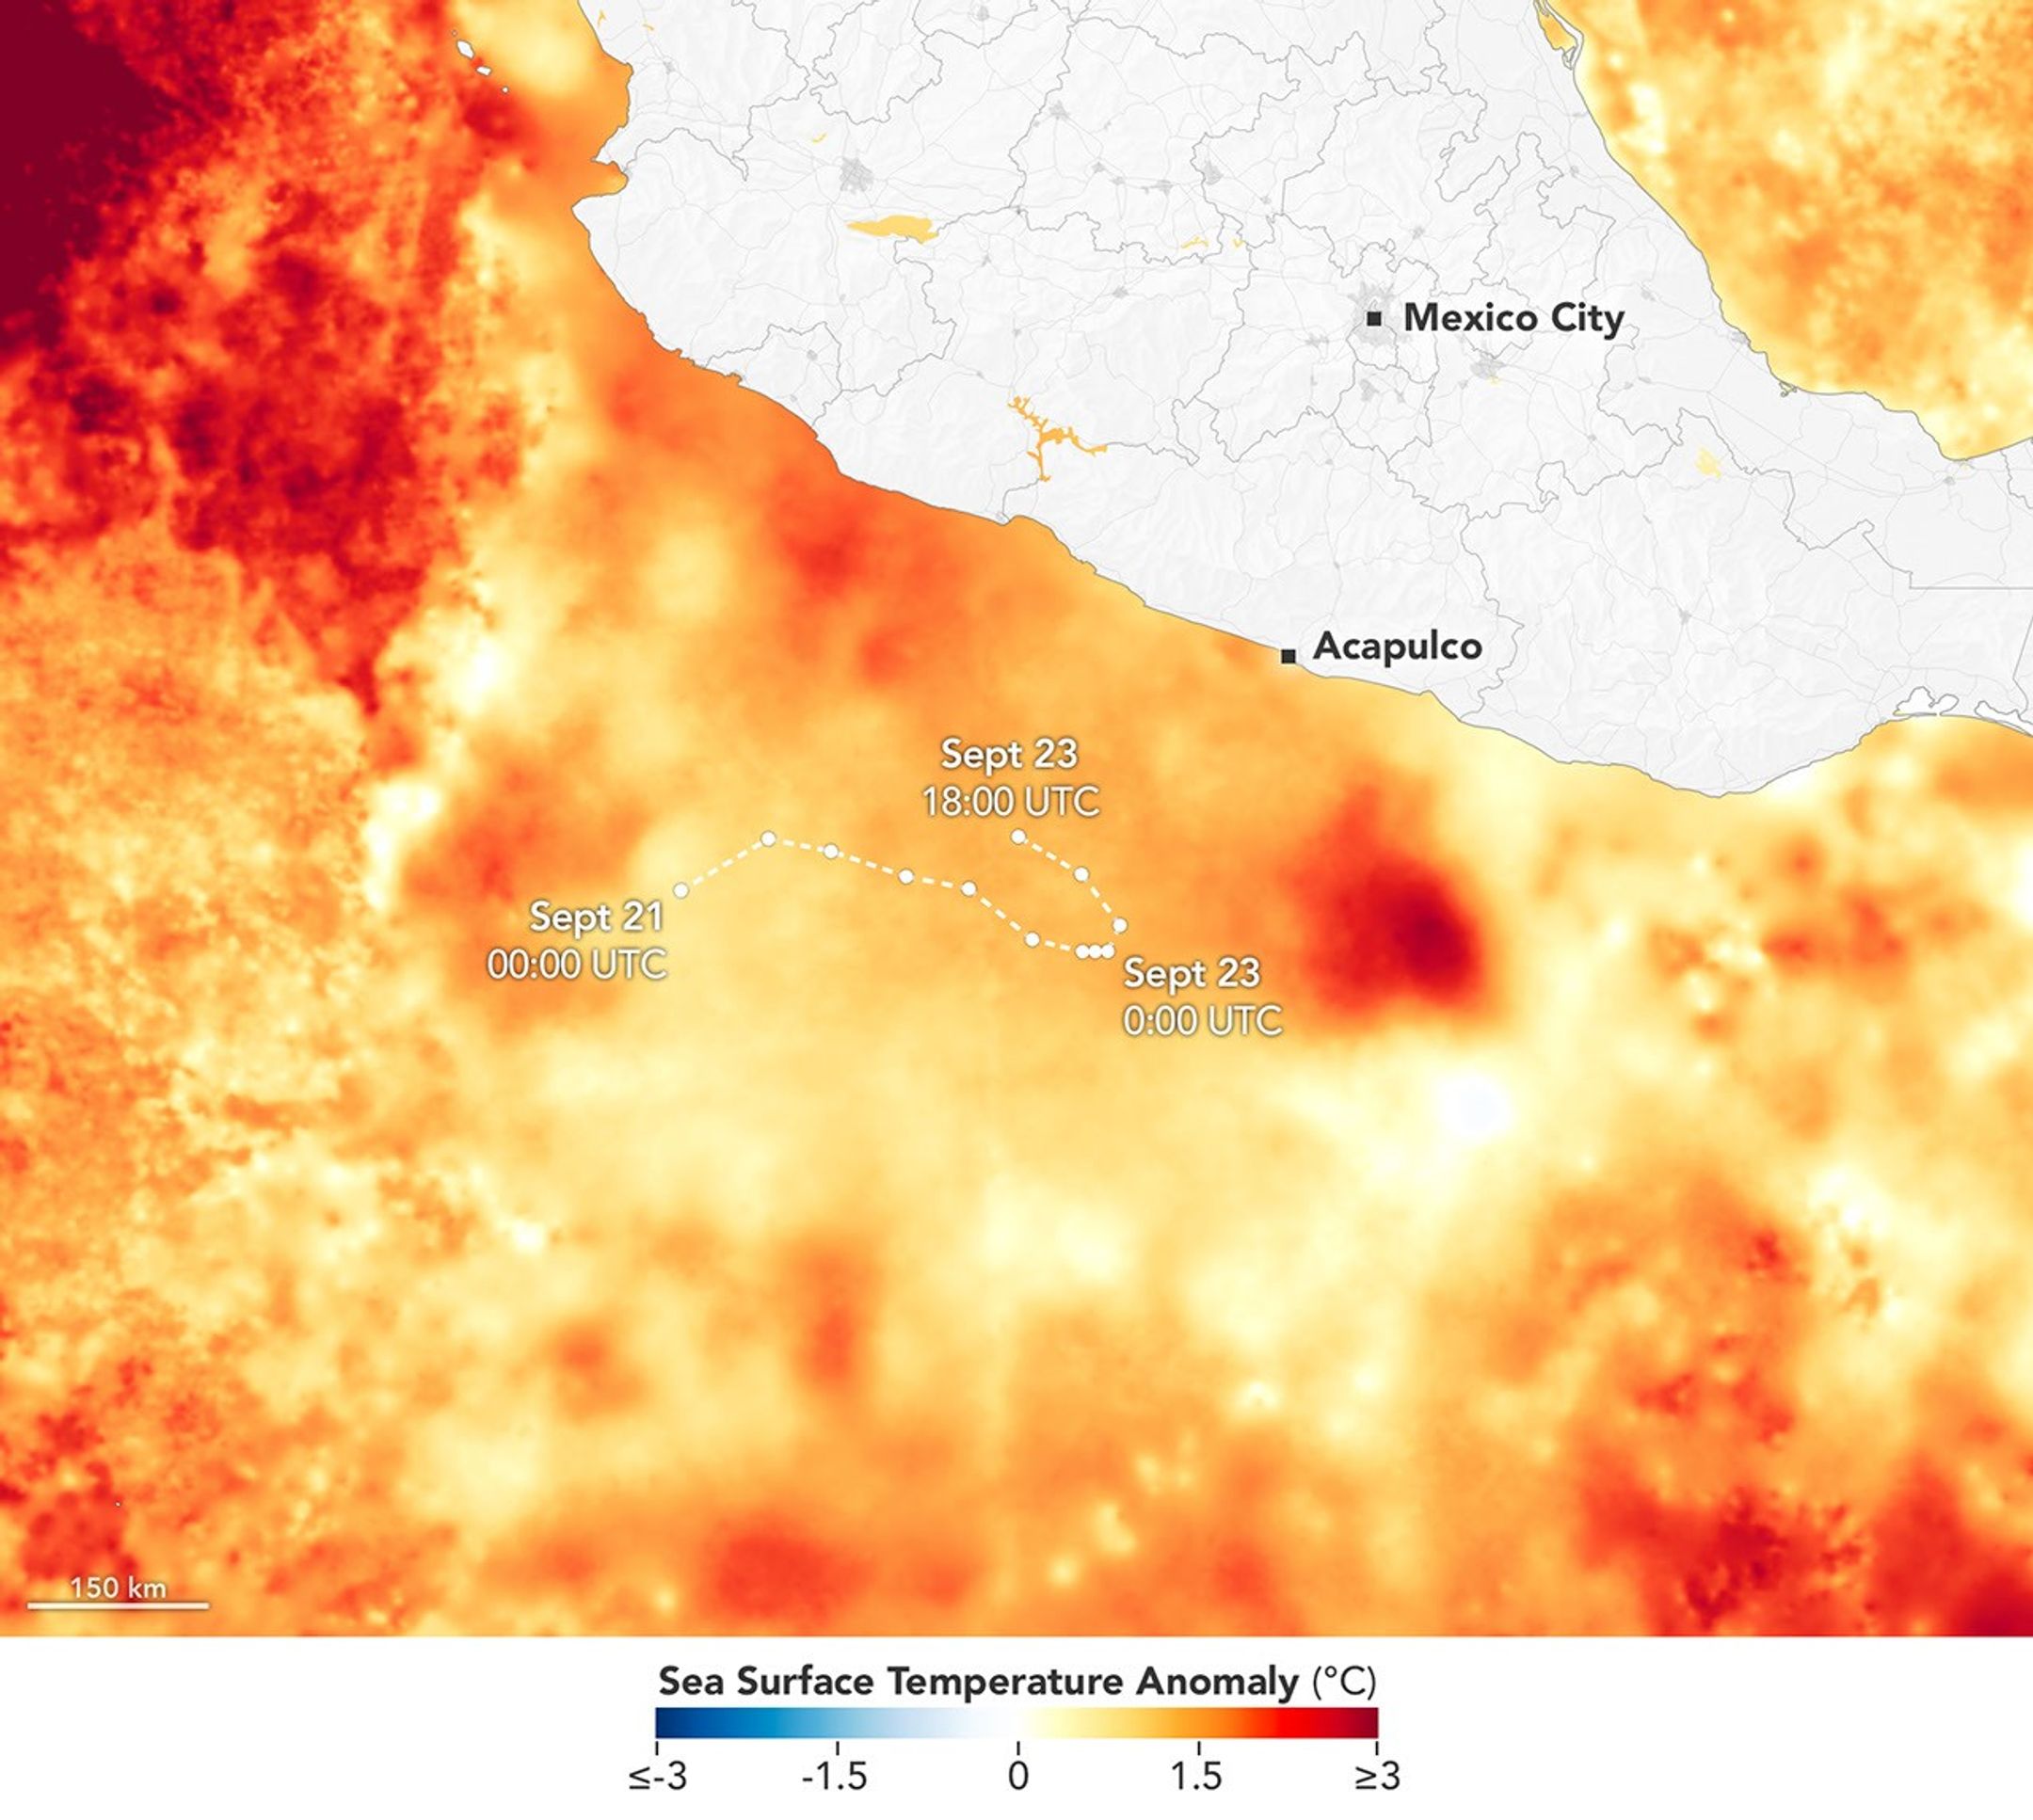
航天图片资料 · A map depicts sea surface temperature anomalies off Mexico's Pacific coast on September 23. Deep red areas highlight areas 3°C above the norm for that date. A dotted line traces the storm's path from September 20 to September 23 as it moved through the unusually warm waters.
A map depicts sea surface temperature anomalies off Mexico's Pacific coast on September 23. Deep red areas highlight areas 3°C above the norm for that date. A dotted line traces the storm's path from September 20 to September 23 as it moved through the unusually warm waters.
资料最后更新时间:
- 图像 SHA-256 校验编号
- cbb8ff5cd8558151f2eba1604741b699793583b8280ac08c634450dcd94d9ea1
- 来源署名
- NASA
- 原始许可标注
- NASA Image and Media Guidelines
- 图像宽度(像素)
- 2160
- 图像高度(像素)
- 1934
- 原始许可链接
- https://www.nasa.gov/nasa-brand-center/images-and-media/
原始图注:
A map depicts sea surface temperature anomalies off Mexico's Pacific coast on September 23. Deep red areas highlight areas 3°C above the norm for that date. A dotted line traces the storm's path from September 20 to September 23 as it moved through the unusually warm waters.

图像 SHA-256 校验编号:cbb8ff5cd8558151f2eba1604741b699793583b8280ac08c634450dcd94d9ea1
来源署名:NASA
原始许可标注:NASA Image and Media Guidelines
图像宽度(像素):2160
图像高度(像素):1934
原始许可链接:https://www.nasa.gov/nasa-brand-center/images-and-media/