航天图片资料 · A global map depicts trends of terrestrial water storage over more than two decades, with increases shown in shades of blue and declines in orange and brown.
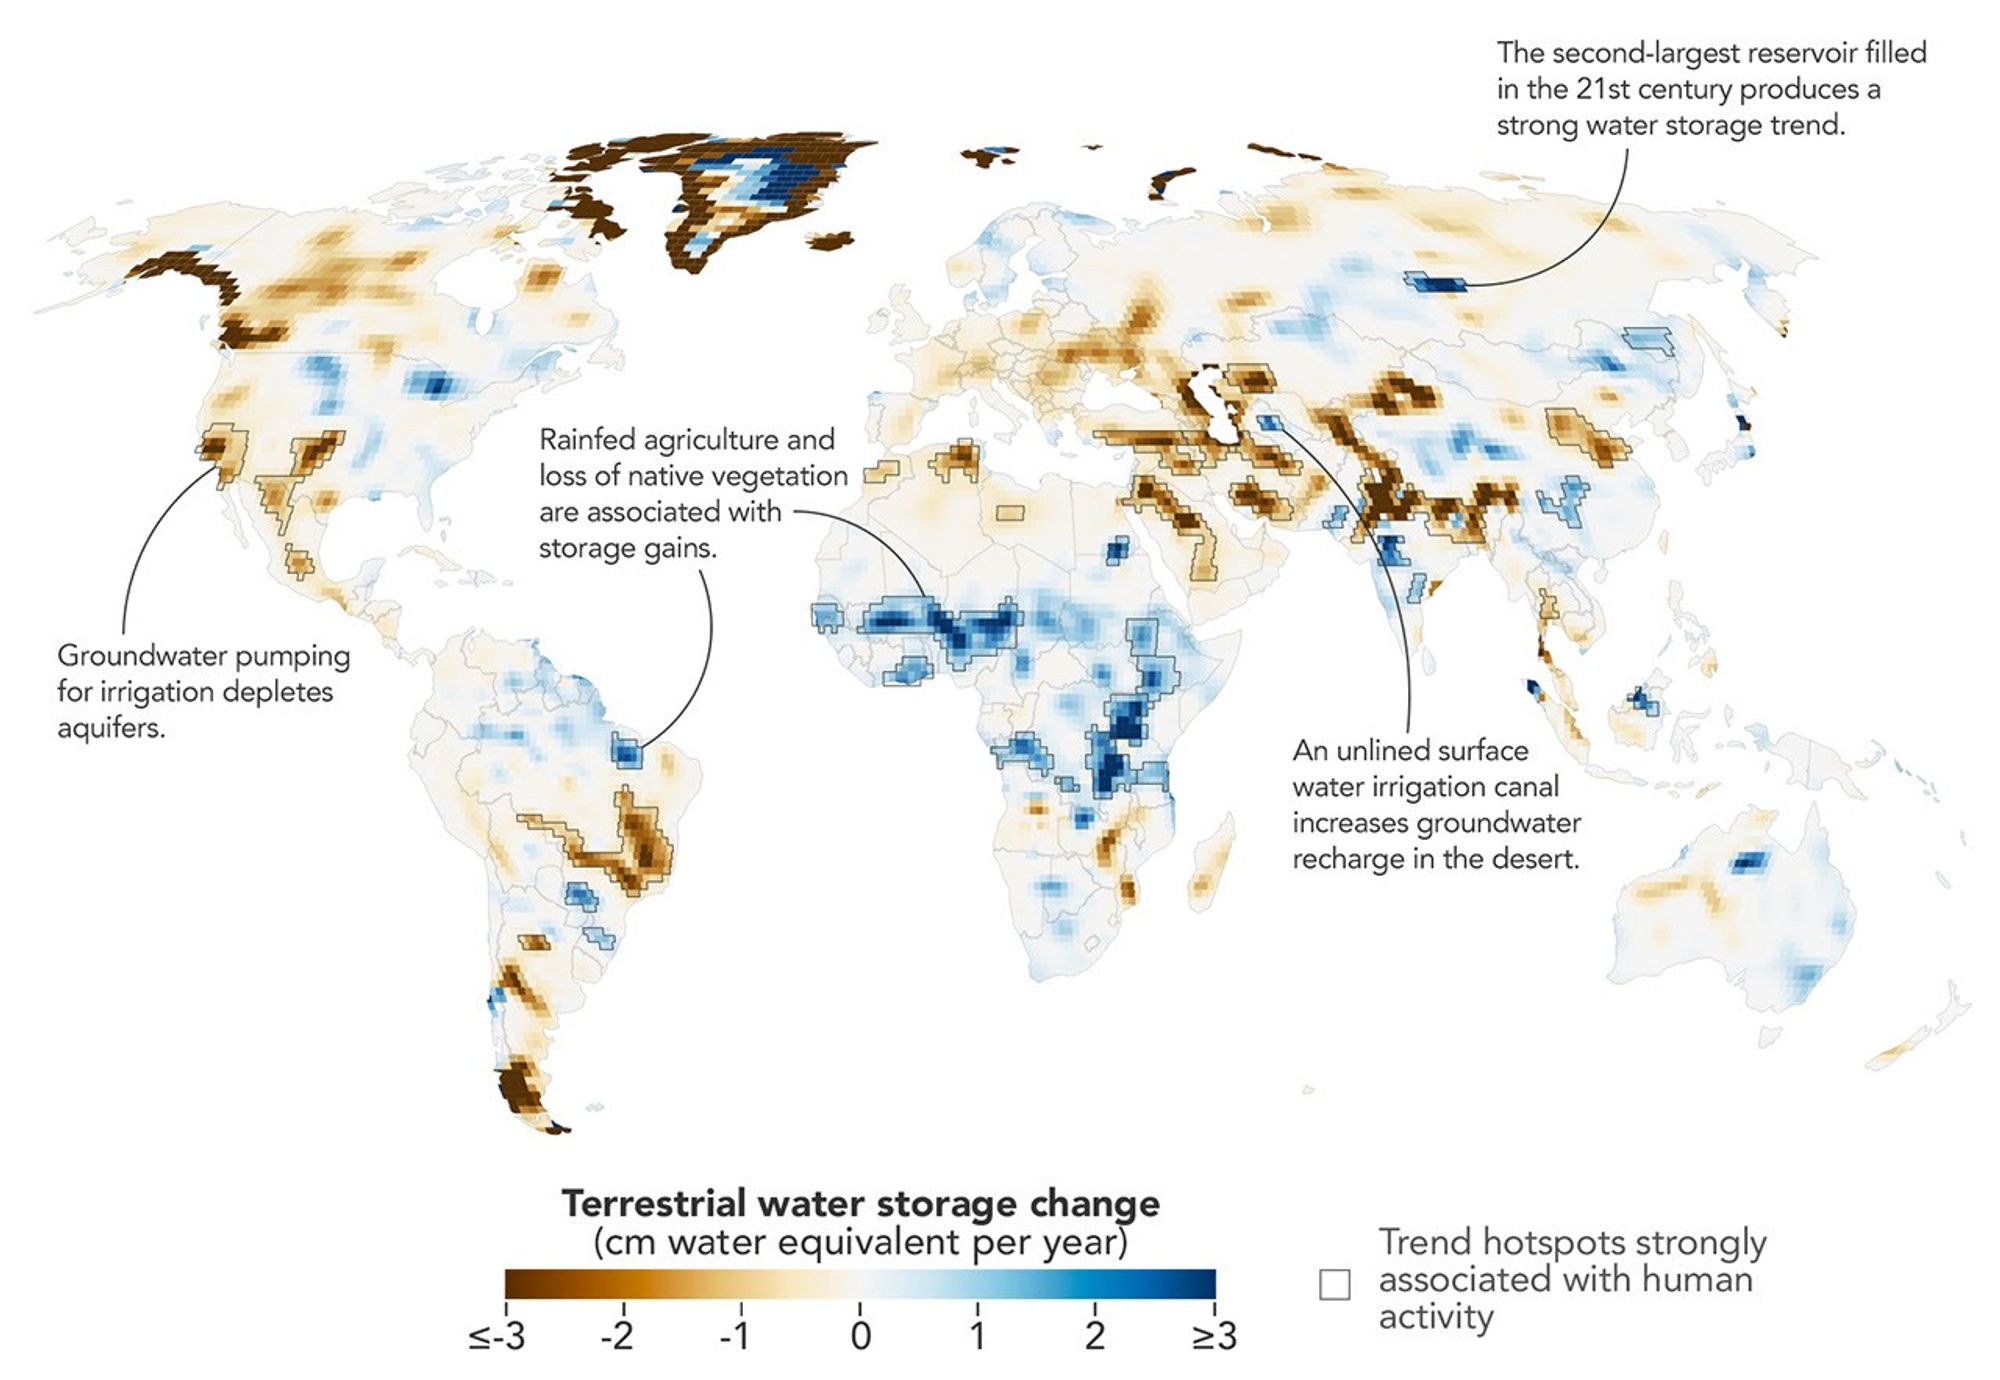
A global map depicts trends of terrestrial water storage over more than two decades, with increases shown in shades of blue and declines in orange and brown.
资料最后更新时间:
- 图像 SHA-256 校验编号
- 609c1220f68c9a69ab5db0a6ab1ec31772af742718fe2f2ef787cb26c413c5f3
- 来源署名
- NASA
- 原始许可标注
- NASA Image and Media Guidelines
- 图像宽度(像素)
- 2000
- 图像高度(像素)
- 1380
- 原始许可链接
- https://www.nasa.gov/nasa-brand-center/images-and-media/
原始图注:
A global map depicts trends of terrestrial water storage over more than two decades, with increases shown in shades of blue and declines in orange and brown.

图像 SHA-256 校验编号:609c1220f68c9a69ab5db0a6ab1ec31772af742718fe2f2ef787cb26c413c5f3
来源署名:NASA
原始许可标注:NASA Image and Media Guidelines
图像宽度(像素):2000
图像高度(像素):1380
原始许可链接:https://www.nasa.gov/nasa-brand-center/images-and-media/