航天图片资料 · 4dba73ce7c476630
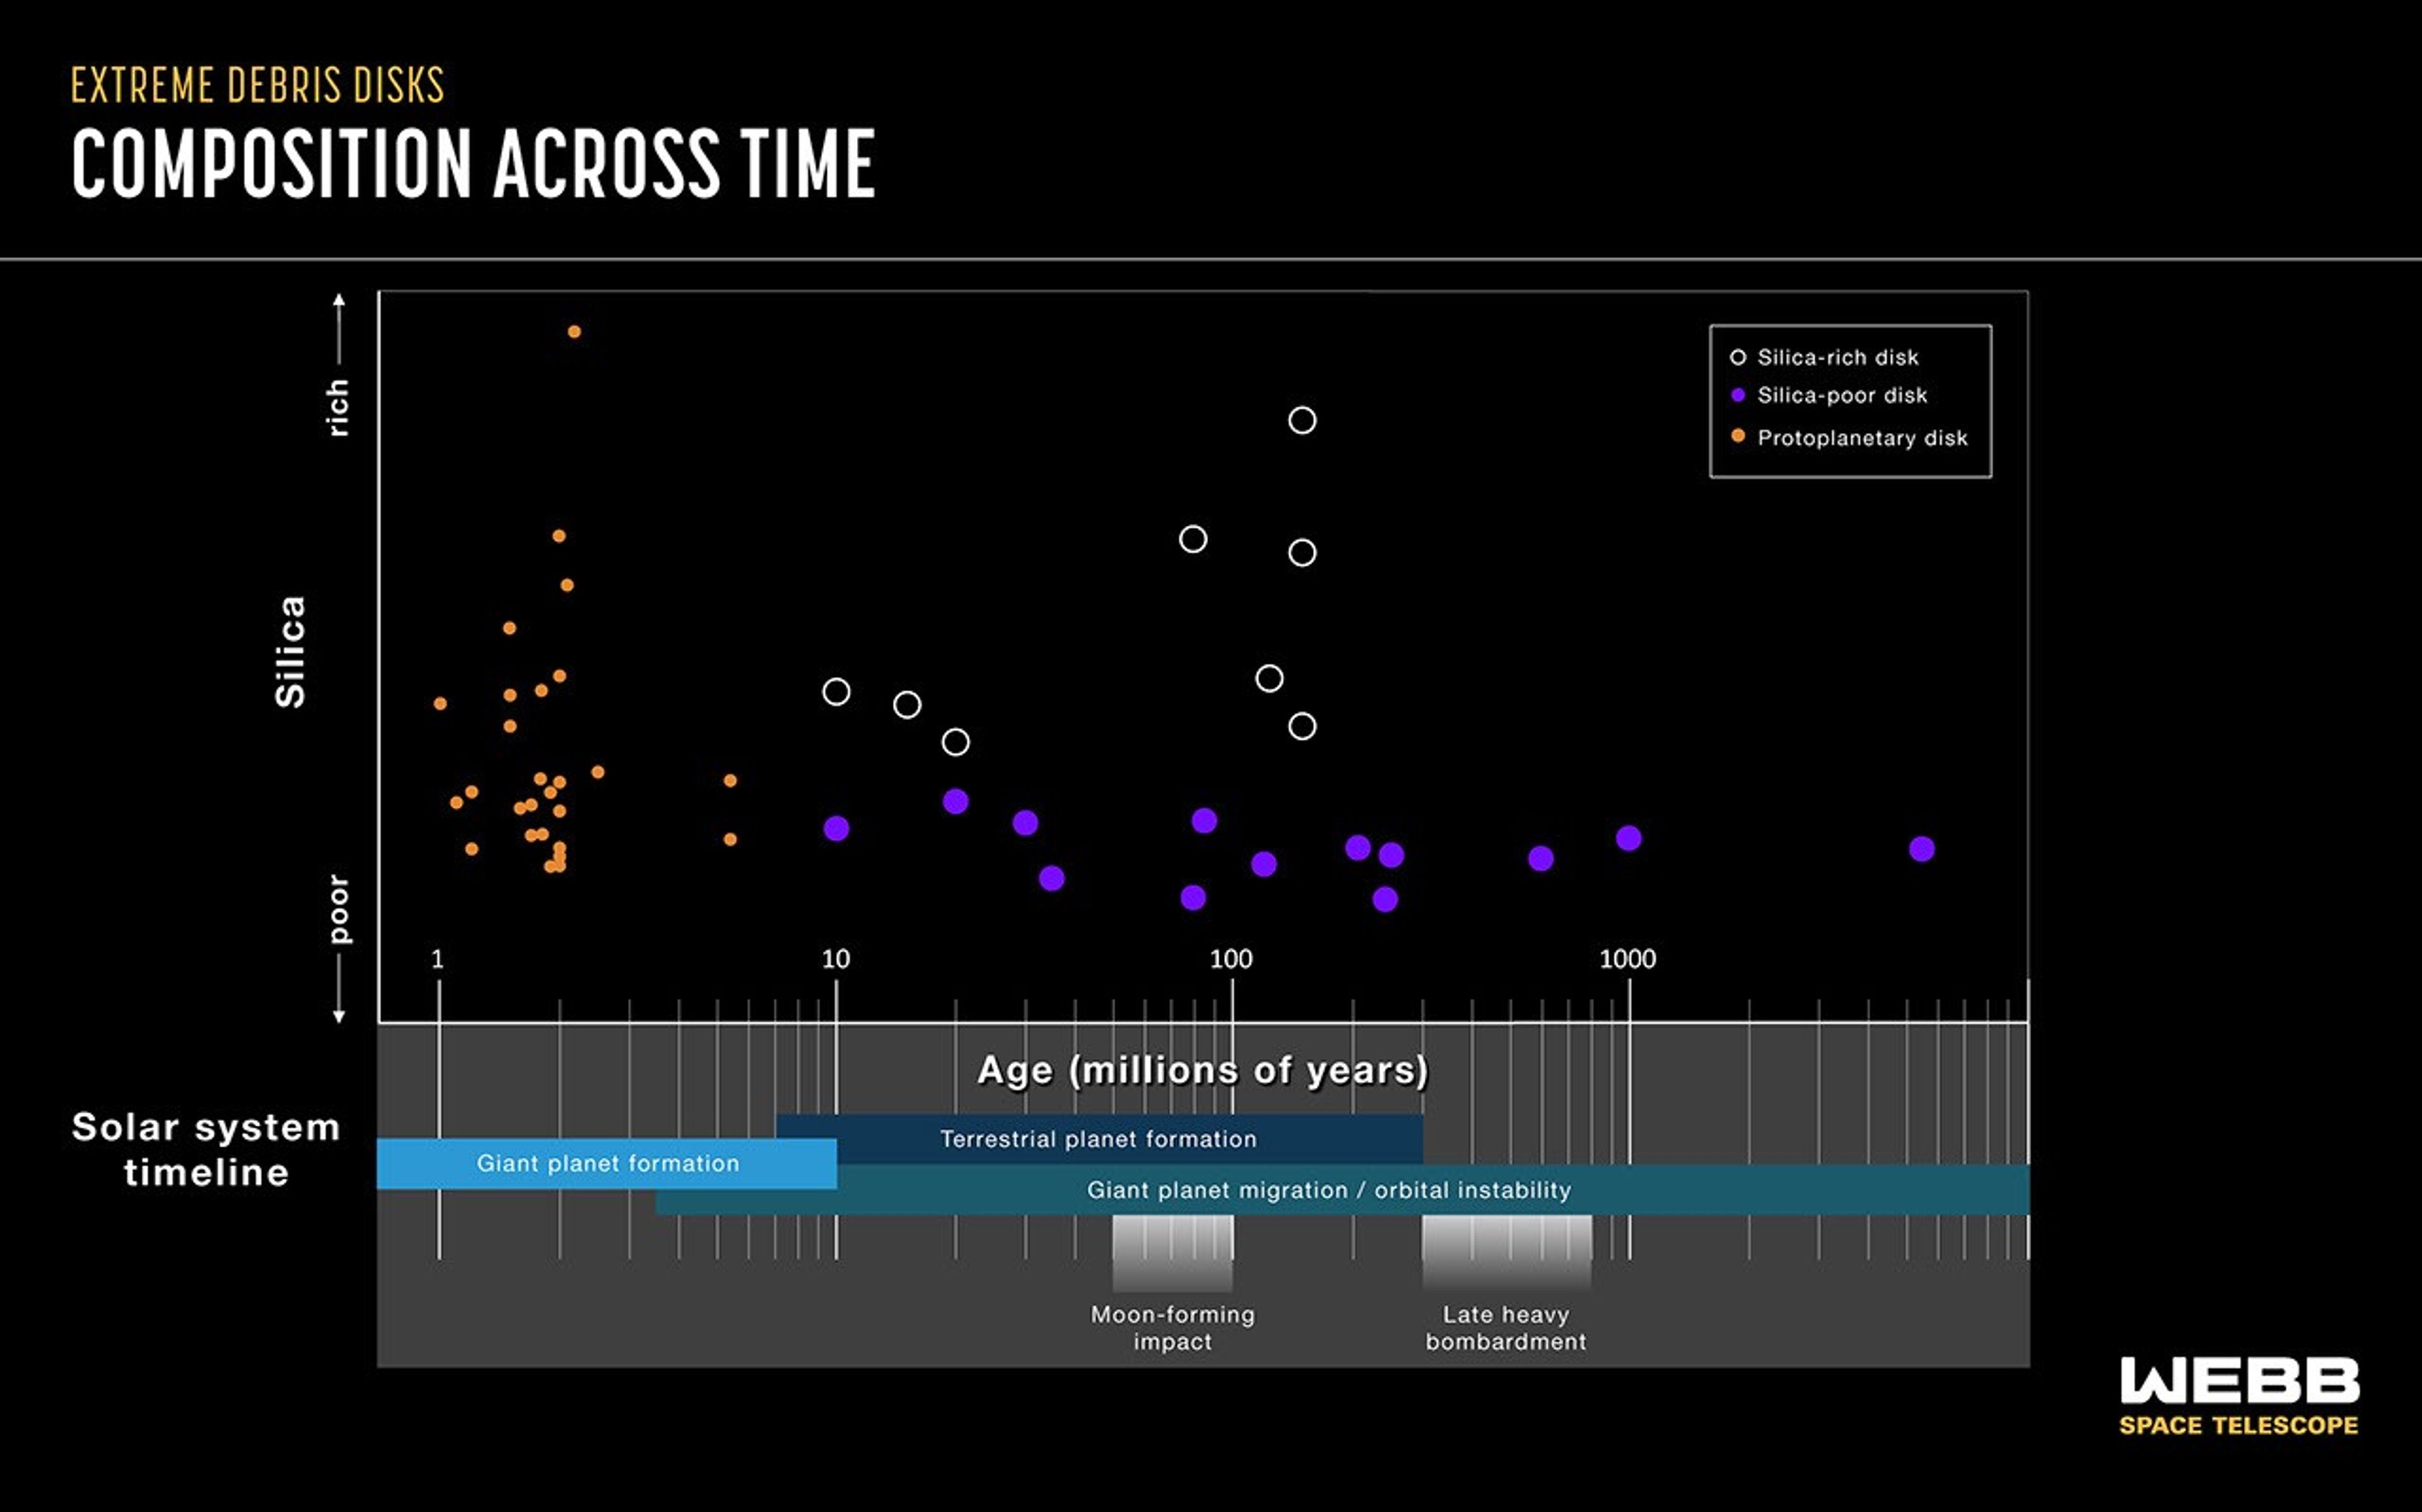
Graphic titled Extreme Debris Disks, Composition Across Time showing a plot and corresponding timeline of the solar system. The plot’s y-axis is labeled Silica with an up arrow labeled rich and a down arrow labeled poor. X-axis is labeled Age (millions of years) and starts with 1 at the left and increases by factors of ten, ending with 1000 at right. A key at right has 3 symbols: black dot is Silica-rich disk, purple is Silica-poor disk, and orange is Protoplanetary disk. All 27 orange dots are
资料最后更新时间:
- 图像 SHA-256 校验编号
- 4dba73ce7c47663002d41d1aaf8199e9ab960d039bdb3549c4182b510b40c6dd
- 来源署名
- NASA
- 原始许可标注
- NASA Image and Media Guidelines
- 图像宽度(像素)
- 3841
- 图像高度(像素)
- 2398
- 原始许可链接
- https://www.nasa.gov/nasa-brand-center/images-and-media/
原始图注:
Graphic titled Extreme Debris Disks, Composition Across Time showing a plot and corresponding timeline of the solar system. The plot’s y-axis is labeled Silica with an up arrow labeled rich and a down arrow labeled poor. X-axis is labeled Age (millions of years) and starts with 1 at the left and increases by factors of ten, ending with 1000 at right. A key at right has 3 symbols: black dot is Silica-rich disk, purple is Silica-poor disk, and orange is Protoplanetary disk. All 27 orange dots are

图像 SHA-256 校验编号:4dba73ce7c47663002d41d1aaf8199e9ab960d039bdb3549c4182b510b40c6dd
来源署名:NASA
原始许可标注:NASA Image and Media Guidelines
图像宽度(像素):3841
图像高度(像素):2398
原始许可链接:https://www.nasa.gov/nasa-brand-center/images-and-media/