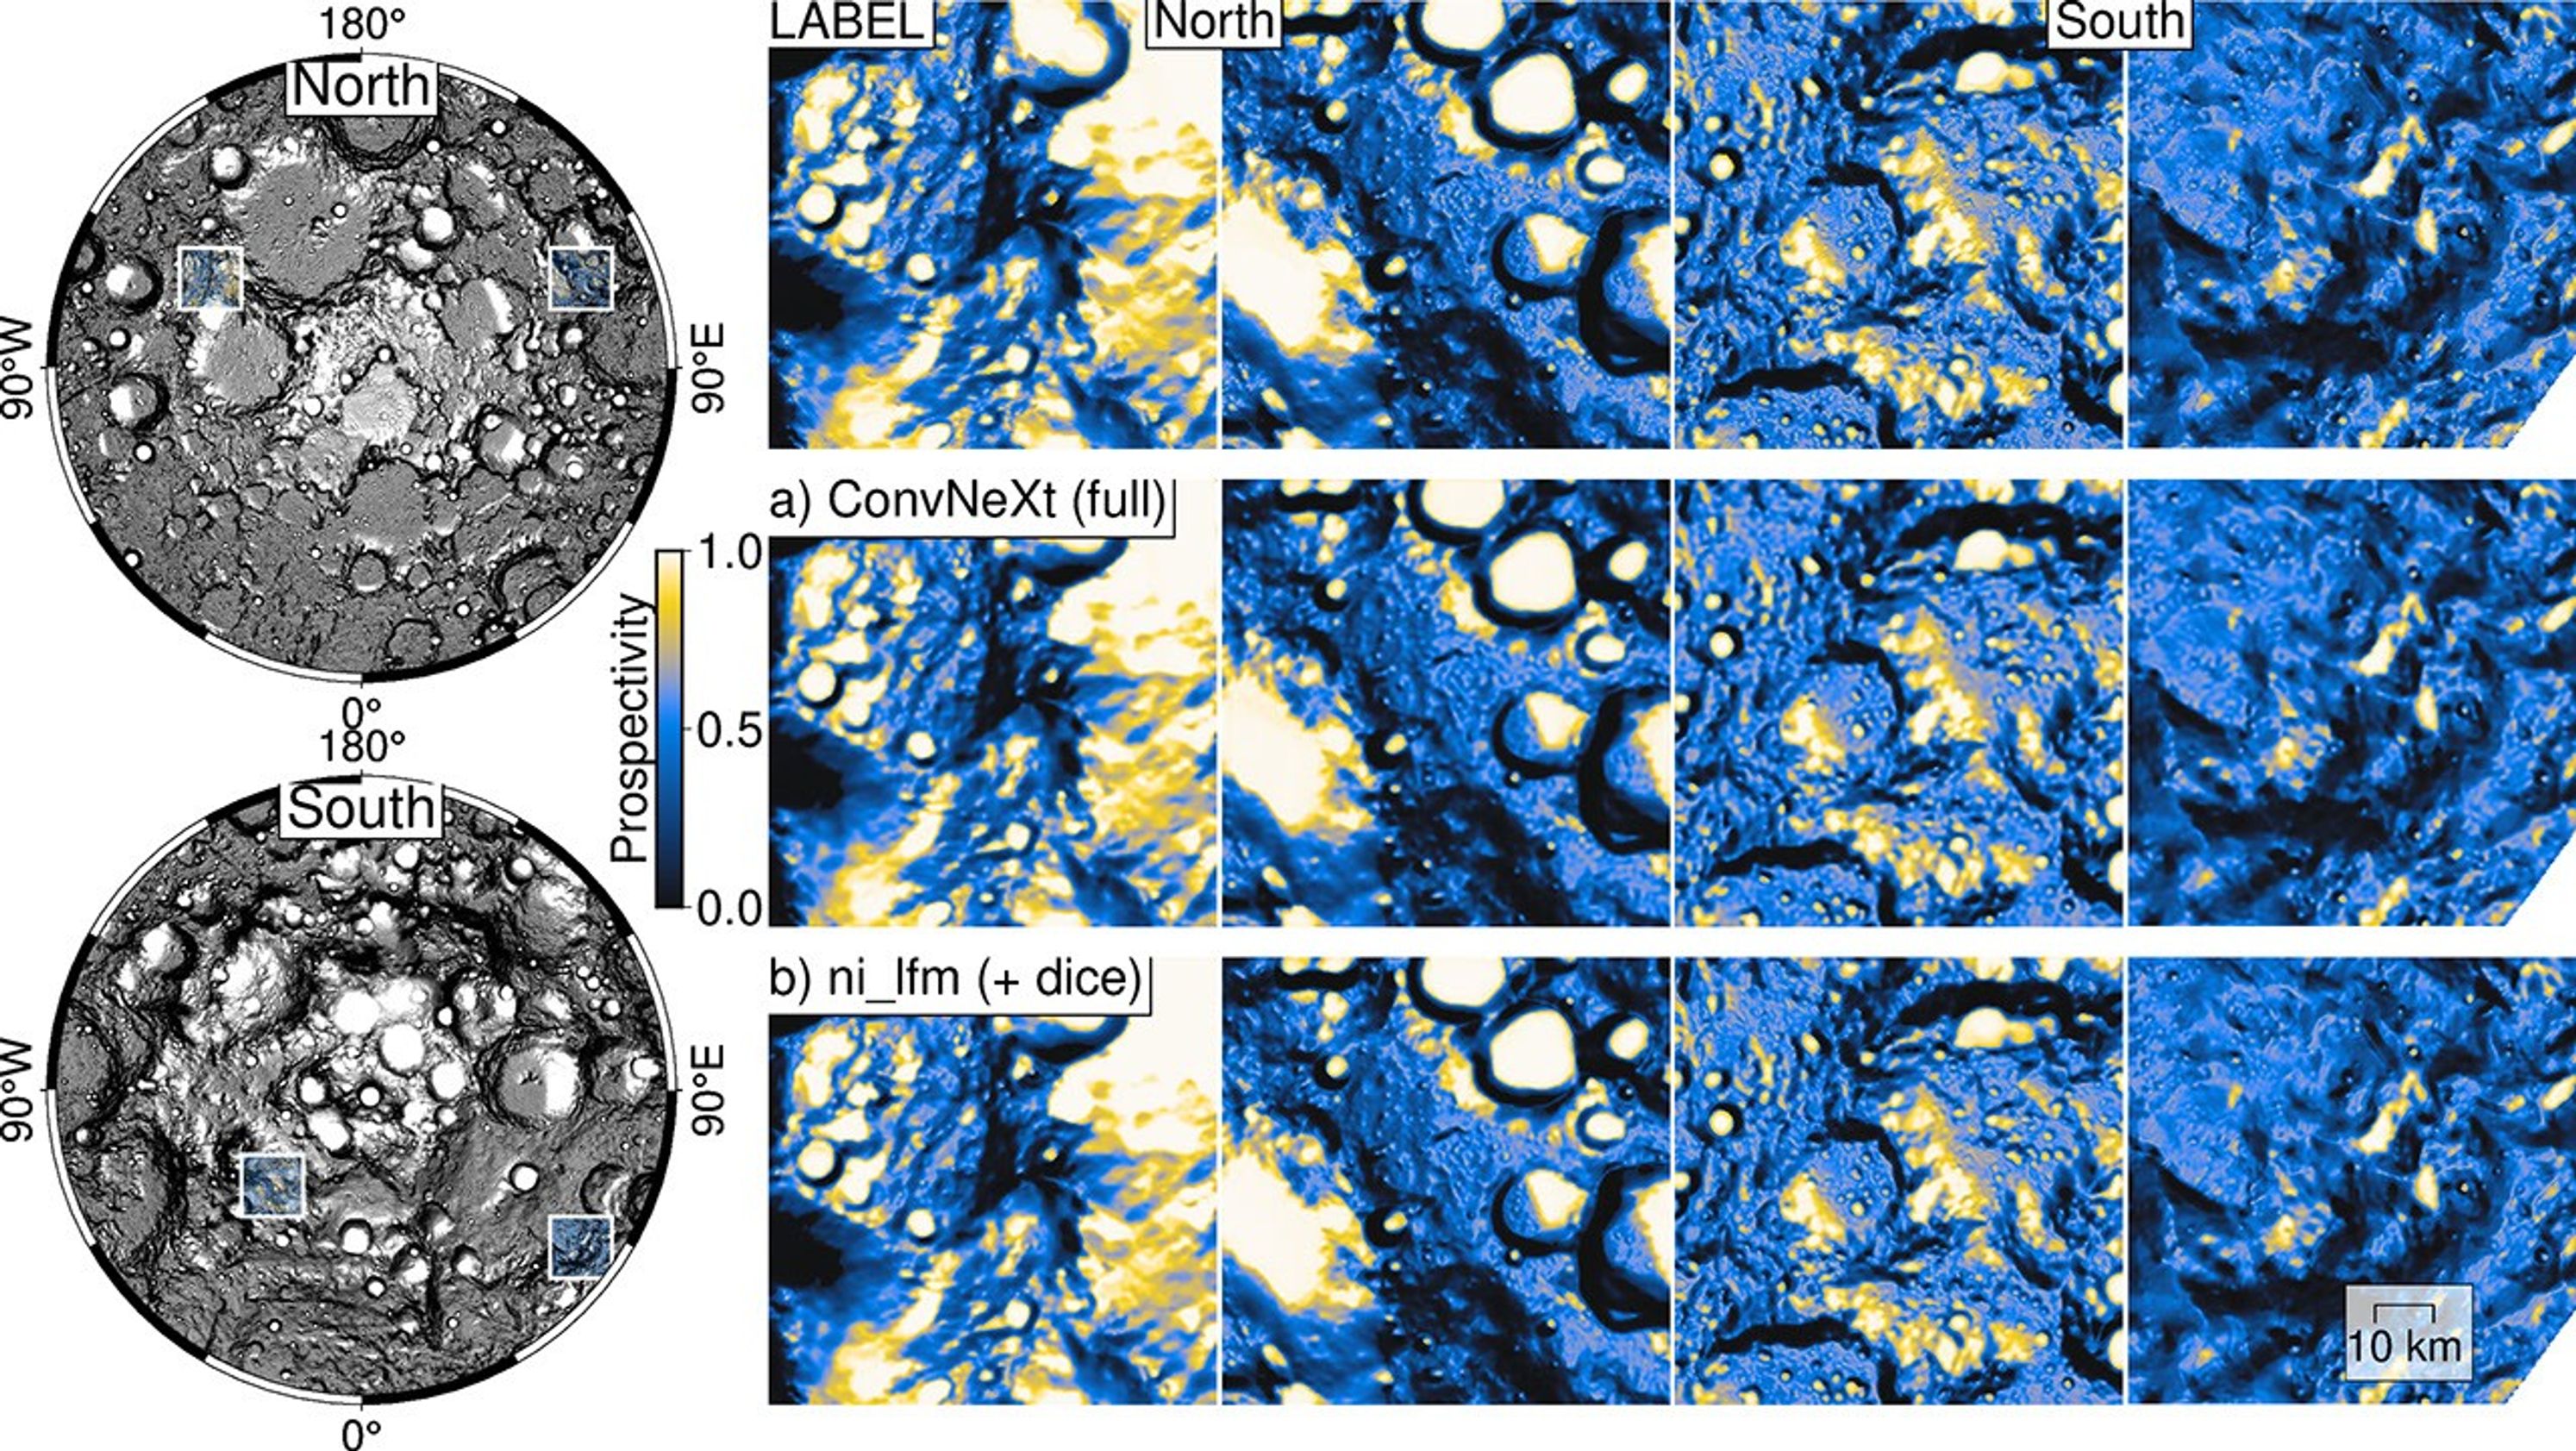
The NASA-IBM model reproduces patterns of lunar ice prospectivity (scaled from blue to yellow), shown at four locations (left) near the Moon’s pole. Top row: reference ice prospectivity map of Mons Mouton near the lunar south pole; bottom row: predictions from the NASA-IBM model. The NASA-IBM model preserves many fine-scale prospectivity patterns in the reference data.图:NASA · NASA Image and Media Guidelines