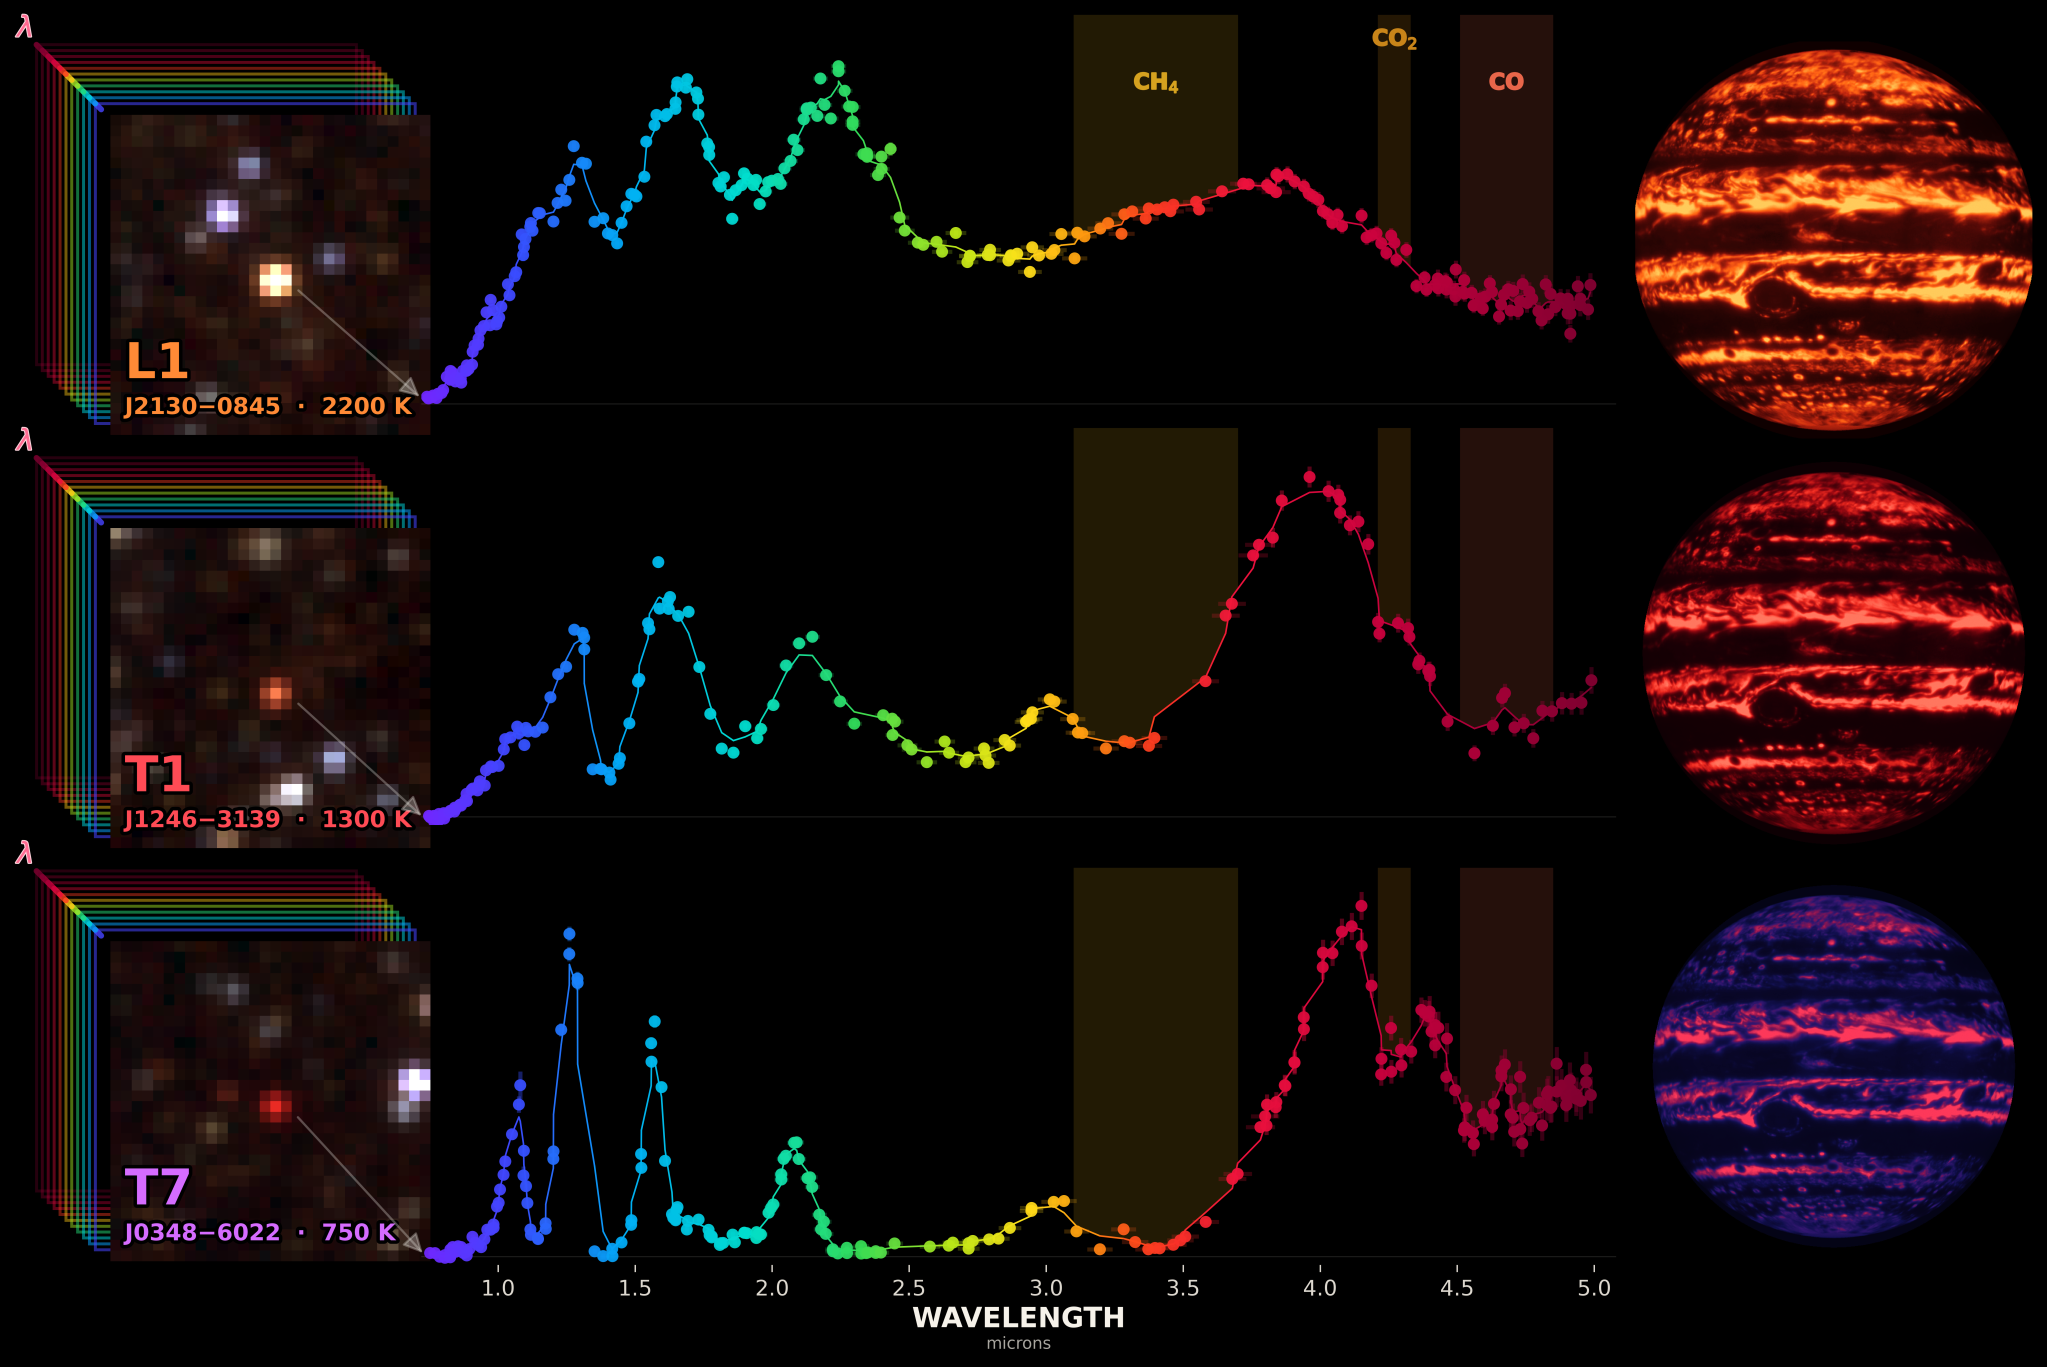
航天图片资料 · An infographic comparing spectra of three brown dwarfs. Plots show wavelength versus brightness with colored data points. Accompanying inset images show the objects in space, and simulated globes represent their atmospheric appearances.
An infographic comparing spectra of three brown dwarfs. Plots show wavelength versus brightness with colored data points. Accompanying inset images show the objects in space, and simulated globes represent their atmospheric appearances.
资料最后更新时间:
- 图像 SHA-256 校验编号
- 21b2a6e95ac5274f9e6e6b57624c7daca13225ffd637d9bd15be46f0dcde51b8
- 来源署名
- NASA
- 原始许可标注
- NASA Image and Media Guidelines
- 图像宽度(像素)
- 2047
- 图像高度(像素)
- 1367
- 原始许可链接
- https://www.nasa.gov/nasa-brand-center/images-and-media/
原始图注:
An infographic comparing spectra of three brown dwarfs. Plots show wavelength versus brightness with colored data points. Accompanying inset images show the objects in space, and simulated globes represent their atmospheric appearances.

图像 SHA-256 校验编号:21b2a6e95ac5274f9e6e6b57624c7daca13225ffd637d9bd15be46f0dcde51b8
来源署名:NASA
原始许可标注:NASA Image and Media Guidelines
图像宽度(像素):2047
图像高度(像素):1367
原始许可链接:https://www.nasa.gov/nasa-brand-center/images-and-media/